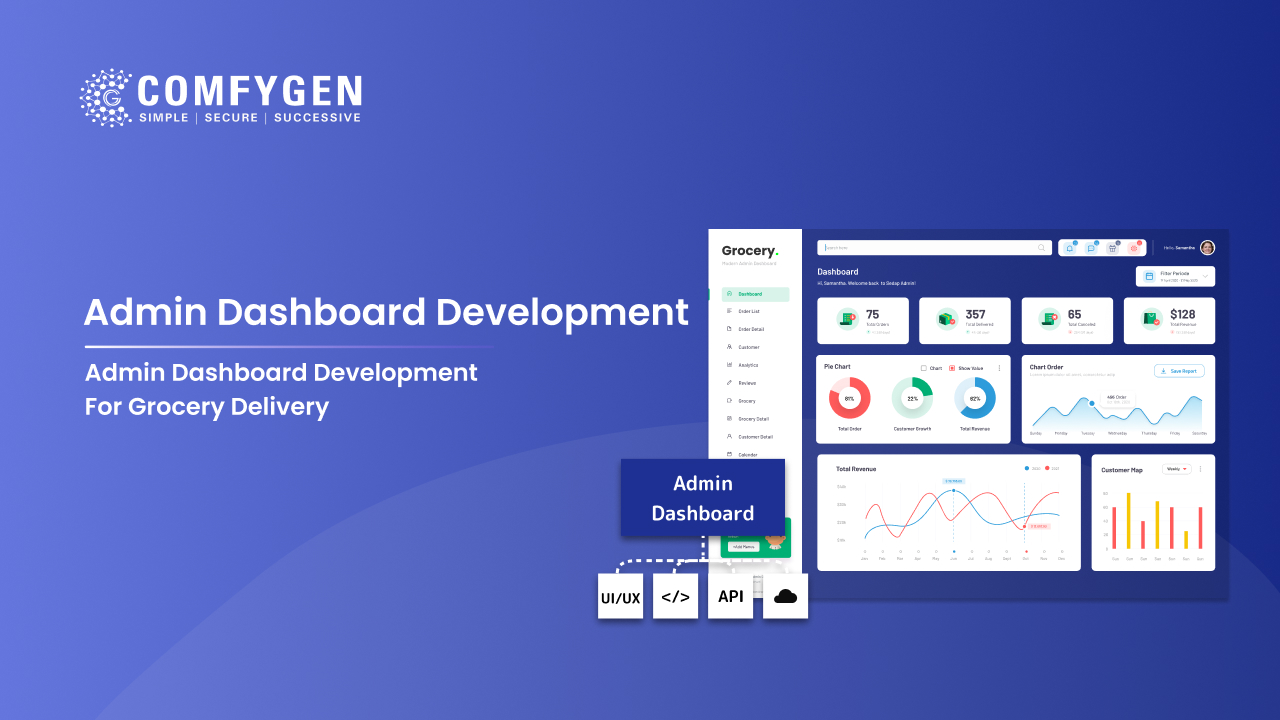





A grocery delivery admin dashboard is the backend panel where you manage orders, stock, vendors, drivers, payouts, and delivery zones from one screen. A basic dashboard costs $5,000 to $10,000 and takes 6 to 8 weeks. An advanced panel with AI forecasting and role-based access runs $25,000 to $50,000. The single most common mistake is opening it on revenue charts instead of on the orders that need attention right now.
Most grocery platforms get the customer app right and underestimate the admin panel. That is backwards. A customer spends three minutes in the app. Your operations team lives in the dashboard all day, and it is where orders get rescued when something goes wrong.
The global online grocery delivery services market is projected to grow from USD 391.59 billion in 2025 to USD 1.51 trillion by 2031, a CAGR of 25.26%, according to TechSci Research. Growth at that rate means order volume roughly quadruples inside six years, and a dashboard built for today’s volume will not hold.
What Is a Grocery Delivery Admin Dashboard?
A grocery app admin panel is the web-based control centre behind the customer app, the vendor panel, and the driver app. It is where the people running the business see everything at once.
Its job splits into three parts, and they are not equally urgent:
| Job | What it covers | How often it gets used |
| Triage | Orders stuck, stock gone, slots oversold, payments failed | Constantly, all day |
| Configuration | Zones, slots, commissions, pricing, staff access | Weekly |
| Reporting | Sales, retention, vendor performance, delivery times | Weekly or monthly |
Most dashboards are built as if reporting were the point. It is not. Reporting is what you read on Monday morning. Triage is what you do at 6pm on a Friday when four orders are stuck and a driver has gone offline.
What Belongs on the First Screen
This is the section competitors skip entirely, and it is the difference between a dashboard people use and one they abandon for a spreadsheet.
The first screen should answer one question: what needs attention right now?
Put these five things on it:
- Orders stuck in one status longer than your threshold, with the status named
- Items that went out of stock after an order was already placed
- Slots running over capacity in the next two hours, by zone
- Drivers idle while orders sit waiting for assignment
- Payments that failed to capture, which is common on weight-priced items
Everything else goes on screen two. Revenue charts, retention curves, and category breakdowns belong in reporting. Nobody fixes revenue on a Friday evening. They fix a stuck order.
A practical test: if your operations lead has to click twice to find out what is broken, the first screen is wrong.
Core Admin Panel Features
Order Management
- Every order across every store in one view
- Filters for delayed, cancelled, disputed, and refunded
- Manual intervention: reassign a driver, change a slot, force a refund
- Full status history per order, so a dispute has a record attached
Stock and Catalog Control
- Product listings by store, since price and availability differ
- Stock levels with low-stock alerts before something runs out
- Bulk upload by CSV or spreadsheet, because nobody adds 10,000 products by hand
- Override controls for when the POS count is wrong
Stock is where most dashboards fail in practice rather than in features. A panel that shows a number is easy. A panel that shows a number matching the shelf is hard, and teams that manage inventory in grocery delivery apps well treat the POS as the single source of truth rather than maintaining a second count.
Slot and Zone Configuration
Delivery zones get drawn as polygons on a map, not defined by postcode lists, because real delivery boundaries follow roads and rivers rather than administrative lines. Each zone carries its own delivery fee, minimum order value, and slot capacity.
Slot capacity needs two separate models:
- Delivery slots are capped by how many drivers are working that window
- Pickup slots are capped by how much staging space you have for bagged orders
Using one number for both oversells pickup every time. Scheduled delivery still dominates the market, holding 59.72% of online grocery delivery share in 2025 while instant and on-demand services grow at over 30% year on year, according to Mordor Intelligence. That split matters for the dashboard, because a platform running both needs slot logic for one and live dispatch for the other.
Driver and Dispatch Control
- Live driver positions and current load
- Assignment mode: nearest driver, batch broadcast, or manual override
- Route sequencing when a driver carries several orders
- Delivery proof with timestamp, photo, or OTP
Batch broadcast sends an order to a group of drivers and moves to the next group if nobody accepts. Nearest-driver assignment is faster but leaves gaps when the closest rider is already loaded. Most platforms end up using both, switched by time of day.
Vendor and Store Management
- Onboarding with document verification and product approval
- Commission rules set per vendor, per category, or per campaign
- Store hours, holiday schedules, and availability toggles
- Performance tracking: fulfilment rate, substitution rate, ratings
Commission handling is what makes a multi-vendor grocery admin panel more work than a single-chain one. The Instacart clone app cost runs higher for the same feature count largely because of this module and the payout reconciliation behind it.
Payments and Payouts
- Multiple gateways with per-region routing
- Vendor and driver payouts on a settlement cycle
- Invoice generation and tax handling by region
- Failed capture queue, which weight-priced items make unavoidable
Reporting
- Sales and revenue by store, category, and slot
- Repeat rate and basket size trends
- Vendor and driver performance
- Substitution and cancellation rates
Numbers on their own change nothing. Useful data analytics in grocery delivery apps turns order history into demand forecasts and restock plans, which is where reporting stops being a wall of charts and starts driving decisions.
Build a Powerful Grocery Admin Dashboard
Manage orders, customers, deliveries, inventory, and payments from one dashboard built around your business needs
Build My Dashboard
How to Design Role-Based Access
Every competitor mentions role-based access as a feature. None of them explain what the roles should be. In grocery, they map to how the business is actually staffed.
| Role | Sees | Cannot see |
| Super admin | Everything | — |
| Area manager | All stores in their region | Other regions, platform finance |
| Store manager | Their store only | Other stores’ sales and margins |
| Picker or floor staff | Order queue and substitution prompts | Any financial data |
| Finance | Payouts, invoices, tax, settlements | Customer personal details |
| Support | Order detail and customer contact | Margins, payouts, vendor commission |
Two rules that prevent most problems:
A store manager must not see another store’s numbers. In a multi-vendor setup those are competitors. Getting this wrong is a commercial issue, not just a technical one.
Support needs customer contact but not margin data. Support staff turn over faster than any other role, so their access should be the narrowest that still lets them resolve a ticket.
The Pickup Staging Board
If you offer click and collect, the dashboard needs a screen that delivery-only platforms never build.
A staging board shows:
- Which orders are picked and bagged
- Which bay each waiting customer is in
- Which bagged orders contain chilled or frozen items, and how long they have been sitting
- Which pickup slot is next
Without it, staff walk out repeatedly to guess which car belongs to which order. With it, a collection takes five minutes instead of twenty.
The cold-chain timer matters most. A bagged order with frozen goods cannot sit in staging for two hours, so the board needs to either delay picking or flag the order for priority handoff.
How the Dashboard Handles Things Going Wrong
Features lists cover the happy path. Operations live on the unhappy one. These five exceptions need a defined place in the panel.
| Exception | What the dashboard must allow |
| Order stuck in picking | See how long, message the store, reassign to another store with stock |
| Item out of stock post-payment | See the substitution offered, the customer response, and force a partial refund |
| Customer unreachable at delivery | Log the attempt, set a retry window, or return to store |
| Payment capture failed | Queue it, retry, or convert to an invoice |
| Substitution dispute | Pull the full record: what was ordered, what was offered, what was approved |
Every one of these is a real operational failure rather than a hypothetical. Several appear among the grocery delivery app development challenges that surface only once live orders start flowing, and the dashboard is where each one gets resolved.
Advanced Features Worth Adding Later
None of these belong in a first build. Each needs order history before it produces anything useful.
Demand forecasting: The reads sales history, season, and local weather to flag what will run out. Store managers get a draft purchase order rather than a spreadsheet.
Automatic replenishment: Triggers a vendor alert or a reorder when stock crosses a threshold.
Dynamic pricing: Adjusts price and offers to demand and stock within limits you set, with a floor price so nothing sells below margin.
Multi-language and multi-currency: Needed once you cross a border, not before.
Anomaly alerts: Flags a store whose substitution rate or cancellation rate jumps, which usually means a stock sync problem rather than a staff problem.
What Grocery Data Actually Tells You
Accurate reporting answers questions that change how the operation runs.
- Which products run out most often, and in which delivery slot
- Which categories spoil before selling, by store
- Which stores show drifting stock counts versus genuine shortages
- How far demand rises before a holiday or a weather event
- Which customers stopped ordering, and what they used to buy
The last one matters most in grocery. Weekly shops repeat, so a customer who skips three weeks has usually gone elsewhere, and that is visible in the data before it shows up in revenue.
Which Tech Stack to Use
| Layer | Choice | Why |
| Frontend | React, Vue, or Angular | Dashboards are data-heavy and benefit from component reuse |
| Backend | Node.js, Django, or Laravel | Handles concurrent reads from several panels at once |
| Database | PostgreSQL or MySQL | Orders, payouts, and audit records need relational integrity |
| Cache | Redis | Live order counts and stock levels, read constantly |
| Live updates | WebSockets | Order status should change on screen without a refresh |
| Charts | Recharts or Chart.js | Enough for operational reporting without a BI licence |
| Auth | OAuth with JWT | Role-based access needs token-level permissions |
One design note: a grocery dashboard is used on a desk for eight hours, not on a phone for two minutes. Build it desktop-first with tablet support for floor staff. Mobile-first design is the wrong default here.
Should You Build It or Buy a BI Tool?
A question nobody else in this SERP addresses, and one worth settling early.
| Capability | Custom dashboard | BI tool (Metabase, Power BI, Tableau) |
| Reporting | Good | Excellent |
| Triage and intervention | Yes | No. Read-only |
| Taking action on an order | Yes | No |
| Cost | $5,000 to $50,000 once | Licence per seat, ongoing |
| Time to set up | 6 weeks up | Days |
In short, a BI tool answers questions about the past. It cannot reassign a driver or force a refund. Most platforms end up with a custom dashboard for operations and a BI tool connected to the same database for analysis. That combination costs less than building enterprise reporting from scratch.
How Much Does an Admin Dashboard Cost?
| Dashboard type | Cost | Timeline |
| Basic | $5,000 to $10,000 | 6 to 8 weeks |
| Intermediate | $10,000 to $25,000 | 8 to 14 weeks |
| Advanced | $25,000 to $50,000+ | 14 to 20 weeks |
Basic covers user management, order tracking, simple stock control, and standard reports. Enough for a single store.
Intermediate adds multi-vendor management, commission rules, payment gateway integration, zone and slot configuration, and proper reporting.
Advanced adds AI forecasting, automatic replenishment, role-based access across several tiers, anomaly alerts, and multi-region support.
Important framing: these figures cover the admin dashboard on its own. A full grocery platform with customer, vendor, and driver apps runs $15,000 to $120,000 or more, with the dashboard included in that total. The grocery delivery app development tiers break the whole platform down by build type and timeline.
What moves the price:
- Number of roles and permission levels
- Multi-vendor commission and payout logic
- Whether you need a pickup staging board
- POS or ERP sync, priced per system
- Number of regions, because tax and currency rules multiply the work
- AI features, which need order history before they work at all
How to Choose a Development Partner
Three questions worth asking, and the answers to listen for.
“Show me an operations screen from a grocery dashboard you built.” Anyone who has built one will have a triage view. Anyone who has not will show you a chart.
“How do you handle stock drift between the app and the POS?” The right answer involves POS sync and short-expiry caching. A wrong answer treats the app as the source of truth.
“What happens when a payment capture fails on a weighed item?” If this question is a surprise, they have not built a grocery platform before.
Comfygen has delivered 550+ projects for 400+ clients across 30+ countries since 2019. Our team builds grocery platforms with the operations panel treated as a product rather than an afterthought, working as a grocery delivery app development company for chains, single-store grocers, and marketplaces.
Every project ships with the source code in your name and a signed NDA from the first call. Comfygen Technologies holds ISO 9001:2015, ISO/IEC 20000-1:2018, and ISO 27001 certification.
Frequently Asked Questions
What is a grocery delivery admin dashboard?
How much does an admin dashboard cost?
How long does it take to build?
What should be on the dashboard home screen?
Can one dashboard manage multiple stores and regions?
Do I need AI in the admin panel?
Can I use Power BI or Metabase instead of building a dashboard?

Mr. Saddam Husen, (CTO)
Mr. Saddam Husen, CTO at Comfygen, is a renowned Blockchain expert and IT consultant with extensive experience in blockchain development, crypto wallets, DeFi, ICOs, and smart contracts. Passionate about digital transformation, he helps businesses harness blockchain technology’s potential, driving innovation and enhancing IT infrastructure for global success.