What is Microsoft Power BI? Uses, Features, and a Comprehensive Guide
Microsoft Power BI is a powerful business intelligence platform designed to help everyday business users collect, analyze, visualize, and share data with ease. Its interface feels familiar to anyone who’s used Excel, making it approachable, while its tight integration with Microsoft’s ecosystem—like Excel, Azure, and Teams—makes it a flexible, self-service tool that doesn’t demand a steep learning curve.
You can grab Power BI Desktop for Windows 10 or 11, or download mobile apps for Windows, Android, or iOS to stay connected on the go. For organizations that need to keep data and reports on-site, Power BI Report Server is the solution, paired with a specialized version of the desktop app called Power BI Desktop for Power BI Report Server.
What is Microsoft Power BI?
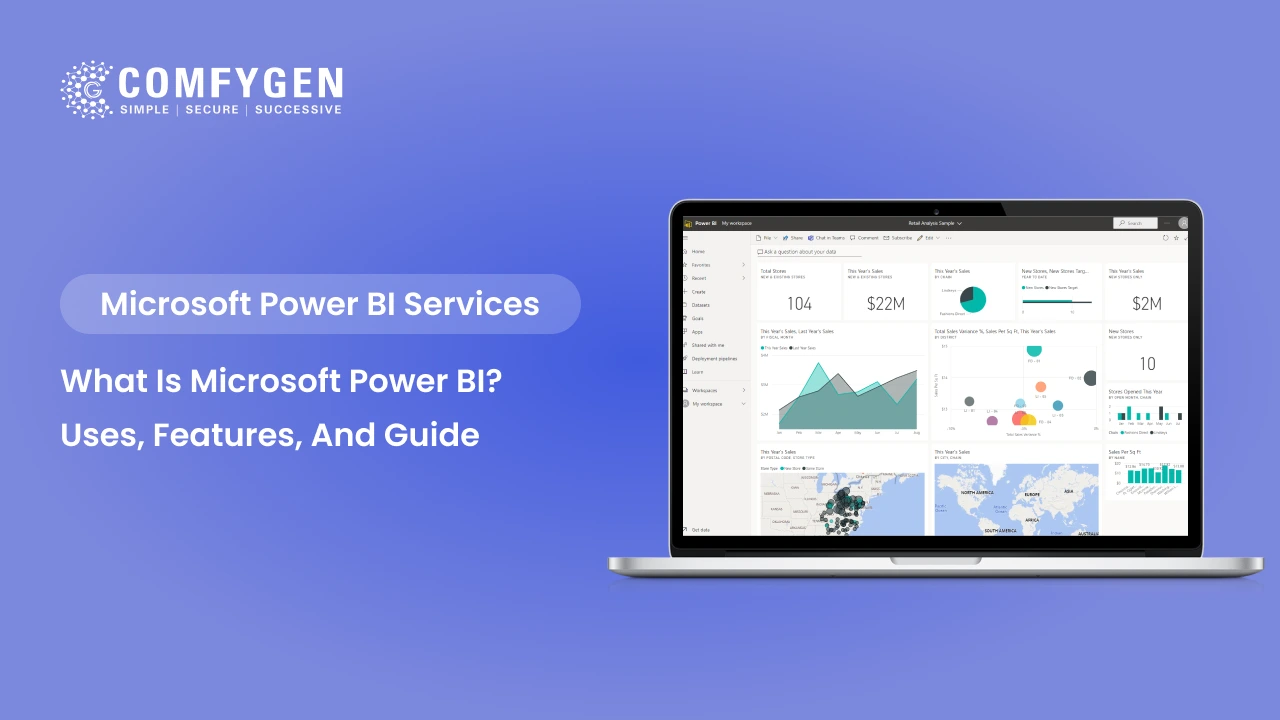
Microsoft Power BI is a suite of business analytics tools that enables users to visualize data and share insights across their organization or embed them in an app or website. Power BI provides a simplified experience for business users, IT professionals, and developers to interact with data through comprehensive dashboards, reports, and embedded services.
Uses of Microsoft Power BI
Microsoft Power BI is a powerful analytics tool used across industries to transform data into actionable insights. It connects to both cloud and on-premises data sources, enabling users to create interactive dashboards and reports. Executives use it for real-time KPI tracking, while finance teams apply it to budgeting and forecasting. Sales and marketing benefit from customer analytics and campaign tracking, and operations gain visibility into inventory and logistics. HR and IT departments use Power BI for workforce analysis and system monitoring. Its flexibility, scalability, and seamless integration make it essential for data-driven decision-making across the enterprise.
1. Data Visualization
Power BI excels in providing interactive data visualizations. It allows users to create reports and dashboards that can be customized and shared across the organization, ensuring that stakeholders at all levels can interact with data in a meaningful way.
2. Data Analysis and Modelling
Power BI gives users the capability to drill down into data for deeper analysis. It connects to multiple data sources and offers advanced functions for creating complex data models that aid in identifying trends and patterns.
3. Real-time Data Access
Power BI can connect to a variety of on-premises and cloud-based data sources, delivering real-time dashboards and reports. This feature is especially valuable for businesses that need up-to-the-minute insights for decision-making processes.
4. Collaboration and Sharing
The platform enables seamless collaboration across teams by allowing the sharing of reports and insights through the Power BI service. This ensures every team member is on the same page with access to the most relevant data.
5. Mobile Accessibility
The Power BI mobile app ensures that data and insights are accessible on the go. This feature provides an adaptable and responsive user experience across different devices, which is crucial for businesses with mobile workforces.
Industry Use Cases of Microsoft Power BI:
Microsoft Power BI is widely adopted across industries due to its ability to adapt to unique data needs and business goals. Its flexibility allows organizations to customize dashboards and reports based on sector-specific KPIs, compliance standards, and operational challenges. Below are key examples of how Power BI is used across various industries:
Healthcare
Power BI is transforming healthcare analytics by enabling providers to gain insights from complex datasets. Hospitals and clinics use Power BI to:
- Monitor patient outcomes and satisfaction.
- Track key performance indicators (KPIs) like readmission rates or wait times.
- Analyze resource utilization (beds, staff, equipment).
- Ensure regulatory compliance with real-time reporting dashboards.
For instance, a hospital can use Power BI to visualize infection trends across departments, identify inefficiencies, and improve response times.
Finance
Financial institutions leverage Power BI to gain transparency, reduce risk, and optimize performance. Key applications include:
- Budget forecasting and variance analysis.
- Profit and loss tracking across business units.
- Fraud detection by monitoring suspicious transaction patterns.
- Portfolio performance analysis for investment firms.
A bank might use Power BI to consolidate customer data from multiple systems, giving executives a 360-degree view of customer profitability and risk exposure.
Manufacturing
Manufacturers use Power BI to improve operational efficiency and product quality. Key applications include:
- Monitoring production line performance and equipment downtime.
- Analyzing supply chain bottlenecks and supplier performance.
- Tracking quality control metrics to reduce defects.
- Forecasting demand to optimize raw material procurement.
For instance, a factory can create dashboards to track real-time machine performance, minimizing downtime and maintenance costs.
Education
Educational institutions leverage Power BI to enhance administrative efficiency and student outcomes. Key applications include:
- Tracking student performance metrics, such as grades and attendance.
- Analyzing enrollment trends and retention rates.
- Monitoring budget allocations and operational costs.
- Evaluating program effectiveness through alumni success metrics.
For example, a university can use Power BI to visualize graduation rates across departments to allocate resources effectively.
Transportation and Logistics
Power BI helps transportation and logistics companies optimize routes, reduce costs, and improve service delivery. Key applications include:
- Tracking fleet performance and fuel consumption.
- Analyzing delivery times and route efficiency.
- Monitoring warehouse operations and inventory turnover.
- Predicting maintenance schedules for vehicles or equipment.
For instance, a logistics firm can use Power BI to visualize real-time delivery delays and optimize route planning.
Let’s build powerful dashboards
and unlock insights
Contact Now
Features of Microsoft Power BI
Microsoft Power BI offers a rich set of features that empower users to connect, visualize, and share data across their organization. Designed for both technical and non-technical users, Power BI combines self-service analytics with enterprise-grade capabilities. Here are some of its key features that make it one of the leading business intelligence tools in the market:
1. Customizable Dashboards
Power BI offers users the ability to create and customize their dashboards. Users can aggregate data from various sources and apply specific analytical models to tailor their dashboards to fit organizational needs.
2. Natural Language Q&A
With the built-in Q&A feature, users can type questions about their data in natural language. Power BI then provides answers in the form of reputable graphs and charts, making data exploration intuitive for users of all skill levels.
3. Integration with Microsoft Suite
A standout feature is its seamless integration with Microsoft’s suite of business applications. Power BI works effortlessly with Excel, Azure, and other tools within the Microsoft ecosystem, enhancing its functionality and appeal.
4. Robust Data Connectivity
Power BI connects to hundreds of data sources, from basic Excel spreadsheets to complex cloud services, such as Azure SQL Database or Salesforce. This versatility in data connectivity allows businesses to pull data from almost any conceivable source.
5. Automated Data Refresh
You can schedule regular data refreshes to ensure your data is always up-to-date. This eliminates the need for manual data uploads and ensures data integrity across platforms.
How to Get Started with Microsoft Power BI: A Comprehensive Guide
Getting started with Microsoft Power BI is simpler than you might think, especially given its user-friendly interface and seamless integration with other Microsoft tools. Whether you’re a beginner exploring data visualization or a business user seeking to create meaningful dashboards, Power BI offers the tools to bring your data to life. Here’s a step-by-step guide to help you start your Power BI journey:
Step 1: Sign Up and Install Power BI
To get started with Power BI, you need to sign up for a Power BI service account and download the Power BI desktop version. Both tools are necessary—the desktop version for creating reports and the service for sharing and collaboration.
Step 2: Connect to Data Sources
Once installed, begin by connecting Power BI to your desired data sources. This could include databases like SQL Server, cloud services like Google Analytics, and simple file-based data in formats like CSV or Excel.
Step 3: Data Preparation
With data loaded into Power BI, the next step is preparing it for analysis. This might involve cleaning the data, integrating data from different sources, and selecting appropriate data types and structures using Power Query Editor.
Step 4: Create Visualizations
Power BI offers a drag-and-drop interface for creating visualizations. Start building your dashboards by dragging data fields onto the report canvas and selecting visualization types that best represent your data insights.
Step 5: Publish and Share
Once reports and dashboards are ready, you can publish them to the Power BI service. Here, they can be shared with others in your organization, enhancing collaboration and data-driven decision-making.
Step 6: Set Up Schedules for Refreshing Data
Ensure your data remains current by setting up data refresh schedules. This setup can be done in the Power BI service and ensures that dashboards and reports are always updated with the latest data.
Final Thoughts
Microsoft Power BI has revolutionized the way businesses handle data analysis and reporting. With its user-friendly interface, robust features, and powerful integrations, it enables organizations of all sizes to make data-driven decisions with confidence. Whether you’re a data analyst, business manager, or IT professional, Power BI provides the tools to transform raw data into impactful insights.
Frequently Asked Questions (FAQs)
Is Power BI free to use?
What is the difference between Power BI Desktop and Power BI Service?
Can Power BI connect to non-Microsoft data sources?
Is Power BI suitable for small businesses?
How secure is Power BI?
Do I need to know coding to use Power BI?
Can Power BI be embedded into custom applications?

Mr. Saddam Husen, (CTO)
Mr. Saddam Husen, CTO at Comfygen, is a renowned Blockchain expert and IT consultant with extensive experience in blockchain development, crypto wallets, DeFi, ICOs, and smart contracts. Passionate about digital transformation, he helps businesses harness blockchain technology’s potential, driving innovation and enhancing IT infrastructure for global success.

