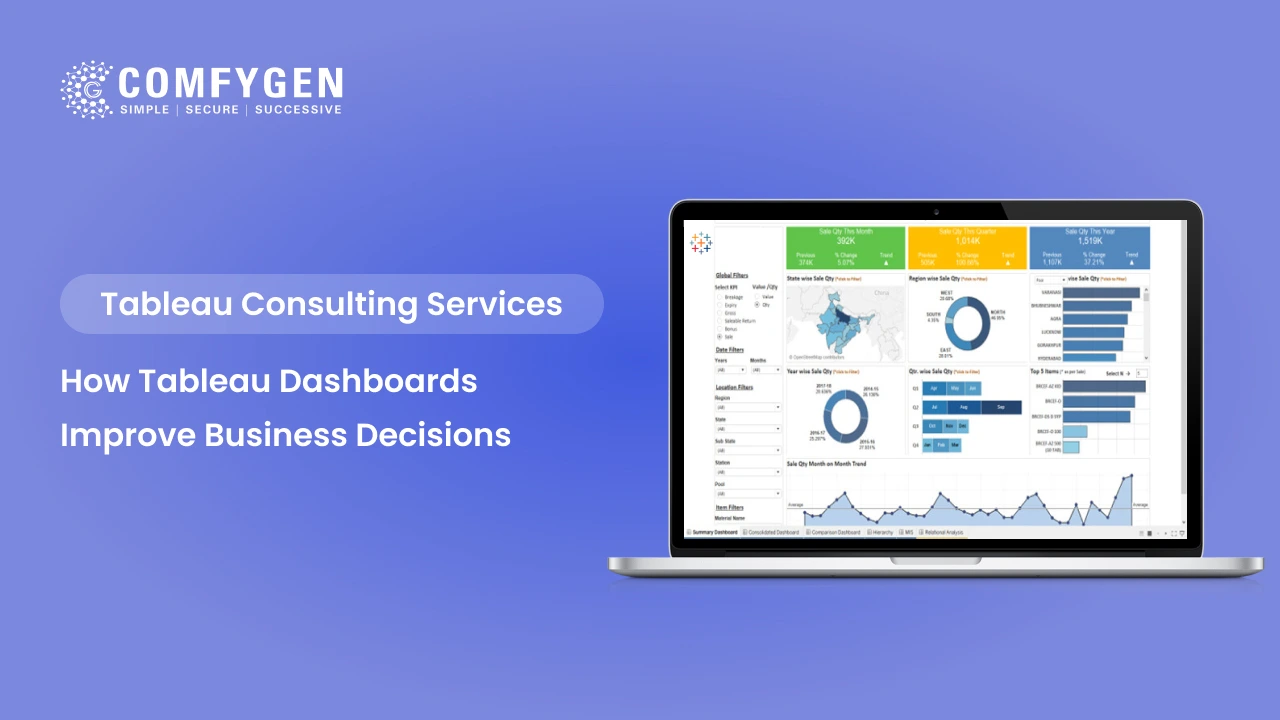
How Tableau Dashboards Improve Business Decisions
Tableau dashboards enhance business decisions by converting raw, granular data into interactive, visually clear insights that are simple to comprehend and respond to. Through real-time updates, configurable visualizations, and drill-down, decision-makers can instantly spot trends, track key performance metrics, and discover masked opportunities or hazards. This enables organizations to make faster and more confident data-driven decisions, eventually leading to improved strategic planning, business operations efficiency, and general business performance.
Understanding the Role of Business Intelligence
In a world overflowing with data, business intelligence tools like Tableau empower companies to distill vast amounts of information into insightful visuals. These visuals are not only easier to understand, but they also reveal trends, patterns, and anomalies that might be missed in traditional reports or spreadsheets.
1. Enhancing Data Accessibility
Tableau dashboards are designed to be user-friendly, allowing individuals across different organizational roles to engage with the data without the need for deep technical expertise. This democratization of data ensures that decision makers at every level can access the information they need when they need it.
2. Real-Time Analysis
Tableau’s ability to connect to live data sources means that businesses can analyze data in real-time. For industries where time-sensitive decisions are crucial, such as finance or retail, having access to the most up-to-date information is invaluable.
How Widely Is Tableau Used in the Industry?
Since its launch in 2003, Tableau has evolved into one of the most trusted and widely adopted business intelligence platforms globally. It was originally developed by researchers from Stanford University to make data visualization more intuitive for non-technical users. Over the years, Tableau has become a comprehensive analytics solution that allows organizations to explore, analyze, and visualize data efficiently.
A Global Adoption Across 86,000+ Companies
Today, more than 86,000 organizations worldwide rely on Tableau for data insights. Its ease of use, powerful analytics, and adaptability have made it suitable for startups, mid-sized companies, and Fortune 500 giants alike. The drag-and-drop interface, integration with various data sources, and highly customizable dashboards make Tableau a top choice for companies seeking to democratize data access and drive innovation through analytics.
Key Features of Tableau Dashboards
Tableau dashboards offer an interactive and visually engaging means to examine data, allowing users to discover insights through filtering, drill-downs, and live updates from multiple data sources. With a simple drag-and-drop interface, users can quickly craft dynamic visualizations that blend charts, graphs, and KPIs into a single, flexible view. These dashboards enable advanced analytics, integration with tools such as R and Python, and accessibility across devices, providing easy access to insights at any time, from anywhere. Tableau also provides features such as data alerts, subscriptions, and secure sharing using Tableau Server or Cloud, making it a robust tool for collaborative data-driven decision-making.
a. Interactive Visualizations
One of the most compelling features of Tableau is its ability to create interactive visualizations. Unlike static charts and graphs, Tableau’s dashboards allow users to drill down into specific data points. This interactivity enables a deeper understanding of the data and encourages exploratory data analysis.
b. Customizable Dashboards
Every business has unique needs and metrics. Tableau accommodates this diversity through highly customizable dashboards. Users can design dashboards that focus on the key performance indicators (KPIs) critical to their business model, making it easier to monitor and assess performance.
c. Seamless Integration
Tableau can seamlessly integrate with various data sources, from traditional databases to cloud services. This integration capability ensures that businesses can centralize their data, making the decision-making process smoother and more efficient.
Improving Business Decisions with Tableau
Tableau greatly improves business decision-making by turning detailed information into simple, actionable answers through interactive dashboards and real-time visualizations. With its intuitive drag-and-drop capability, users of any technical level can analyze data, find trends, and spot opportunities or risks in a matter of minutes. Tableau consolidates data from various sources in a single, coherent view and dissolves information silos, facilitating cross-functional collaboration. Its cutting-edge analytics capabilities, such as forecasting and AI-powered insights, enable organizations to make predictive, data-informed decisions that fuel growth, productivity, and competitive edge.
a. Simplifying Complex Data
With Tableau, complex datasets are simplified through intuitive visual representations. This simplicity allows stakeholders to grasp the essentials of the data without sifting through cumbersome details. By highlighting critical metrics and trends, organizations can focus on strategic planning rather than data interpretation.
b. Proactive Problem Resolution
Tableau dashboards help identify issues before they escalate by highlighting anomalies and trends. For example, a sudden drop in sales can be quickly spotted and investigated, allowing teams to address potential problems proactively. This foresight enables companies to adopt a proactive rather than reactive approach, saving time and resources.
c. Enhanced Collaboration
Tableau supports collaborative work environments, fostering better communication and alignment among teams. Dashboards can be shared across departments, ensuring everyone is on the same page. Enhanced collaboration leads to well-rounded decision-making, incorporating diverse perspectives and expertise.
Ready to Build a Custom
Tableau Analytics Dashboard for Your Business?
Contact Now
Real-World Applications of Tableau
- Retail Industry: Inventory Management
For retailers, managing inventory efficiently is vital. Tableau’s dashboards can integrate with supply chain data to provide real-time insights into stock levels, demand forecasts, and supplier performance. This information helps retailers optimize inventory levels, reducing carrying costs and preventing stockouts. - Financial Services: Risk Management
In the financial industry, risk management is crucial. Tableau’s dashboards can analyze investment portfolios and market conditions, alerting firms to potential risks or opportunities. By visualizing complex risk data, financial institutions can make data-driven decisions that enhance their risk profiles and ensure regulatory compliance. - Healthcare: Patient Care Optimization
In healthcare, patient care and operational efficiency are intertwined. Tableau dashboards can consolidate patient data, treatment outcomes, and resource allocation statistics into a centralized platform. Healthcare providers can then streamline operations and improve patient care quality by making informed decisions based on real-time data.
Overcoming Challenges with Tableau
Tableau is generally well known for its simplicity of use and ability to provide stunning data visualizations, its successful deployment can also raise various issues that have to be overcome by organizations to take full advantage of it. Matters like uneven data quality, inadequate user training, integration with intricate data sources, performance delays, and proper data security can impede adoption and diminish its overall effectiveness. To get over these obstacles, companies require a strategic solution that encompasses solid data governance, continued user education, scalable architecture, and security best practices. By being proactive in these areas, organizations can realize the full potential of Tableau and lead smarter, faster, and more confident decision-making at all levels.
a. Ensuring Data Quality
While Tableau offers impressive visualization capabilities, the accuracy of these visuals is contingent on data quality. Businesses must ensure their data is clean, accurate, and up-to-date to derive meaningful insights from Tableau dashboards.
b. Training and Adoption
For organizations new to Tableau, adequate training is crucial to unlocking its full potential. By investing in employee training and development, businesses can ensure widespread adoption and effective use of Tableau tools.
c. Data Security and Privacy
As data is often sensitive, ensuring its security and compliance with privacy regulations is mandatory. Tableau offers robust security measures, but organizations must also implement internal policies to safeguard data privacy.
Conclusion
Tableau dashboards are a powerful asset for businesses seeking to make informed, data-driven decisions. By transforming complex datasets into intuitive, interactive visualizations, Tableau empowers decision-makers at all levels to act with confidence, agility, and precision. Its real-time analytics capabilities, seamless integrations, and customizable dashboards make it an essential tool for organizations across industries — from retail and finance to healthcare and beyond.
Frequently Asked Questions (FAQs)
What is a Tableau dashboard?
How can Tableau help my business make better decisions?
Do I need technical skills to use Tableau dashboards?
Can Tableau integrate with our existing data sources?
How often can Tableau dashboards update data?
Is Tableau suitable for small businesses or just large enterprises?
What are some common use cases for Tableau dashboards?
How secure is the data in Tableau?
How long does it take to implement Tableau dashboards in an organization?
What support or training is available for Tableau users?

Get in Touch
Our developers are focused to bring optimum outcomes through our.

Mr. Saddam Husen, (CTO)
Mr. Saddam Husen, CTO at Comfygen, is a renowned Blockchain expert and IT consultant with extensive experience in blockchain development, crypto wallets, DeFi, ICOs, and smart contracts. Passionate about digital transformation, he helps businesses harness blockchain technology’s potential, driving innovation and enhancing IT infrastructure for global success.